
The Numbers Game: How Data and Analytics Became the Ultimate Fan Experience in 2026
The Death of the Passive Couch Potato
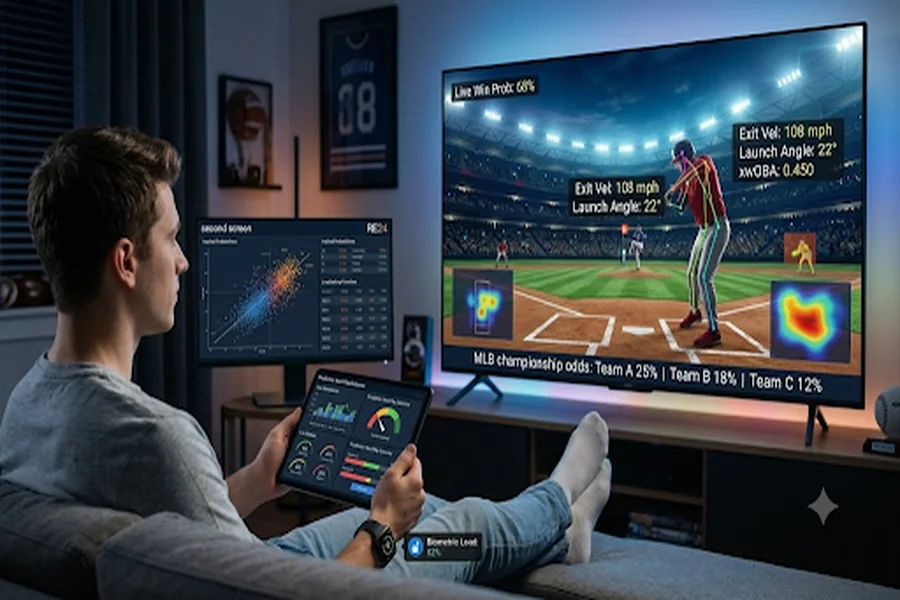
A decade ago, a fan just grabbed a beer and waited for the morning paper to deliver the box score. The landscape looks entirely different today. Peer over the shoulder of an average guy on a Sunday afternoon. He operates less like a casual observer and much more like a junior quantitative analyst clocking in from a recliner. Passive consumption is dead. Today’s audience requires a heavy diet of expected goals (xG) alongside live win probabilities, not to mention skeletal pose-estimation graphics crammed onto their secondary devices. Moneyball was a cute, retrospective experiment for front-office nerds analyzing spreadsheets days after a match ended. Today, predictive machine learning models spit out probabilities in real time for a global, hyper-educated audience.
Look at the financial projections, and the sheer scale is ridiculous. The financial gravity of this obsession is frankly absurd. We will likely see the analytics sector eclipse $10 billion in value within a few short years. Meanwhile, that massive umbrella we call fan engagement sits on a trajectory to hit an unfathomable $44 billion. Institutional capital just keeps flooding the zone. Smart stadiums in North America slash energy costs using IoT sensors while piping low-latency data feeds straight to sportsbooks. Franchise-driven analytics mandates in the Asia-Pacific region—particularly within the Indian Premier League (IPL)—simultaneously push regional growth past a staggering 25% annual rate.
Math Class in the Bleachers
Eavesdrop on a heated debate at your neighborhood pub. The intellectual baseline has shifted entirely. Guys simply refuse to argue over traditional counting stats anymore. Metrics like basic batting average or raw goal totals belong in a museum. The modern viewer understands that evaluating a pitcher by their Earned Run Average is a fool’s errand. Fans look at Fielding Independent Pitching (FIP) instead to mathematically strip away bad defense and sequence-based luck.
A genuine philosophical war is raging right now—it pits pure physical contact against situational context. Take Expected Weighted On-Base Average (xwOBA) as the perfect example. This specific metric actively ignores the score or the inning. It grades a batter entirely on the violent geometry of the hit—launch angles and exit velocities—to dig out a player’s true, underlying skill level. The counterweight to that logic is Win Probability Added (WPA). A savvy viewer uses WPA to assign an exact mathematical value to a clutch hit when a team is down to their final out. This granular obsession changes everything about season-long narratives.
A local baseball franchise could string together a miraculous streak of one-run victories. Sharp analysts spot that impending collapse from a mile away. They dig straight into run differentials and Pythagorean expectations to expose the true, underlying caliber of a roster. Let’s be real about this shift. The entire conversation dictating MLB championship odds has completely abandoned emotional hometown bias, pivoting aggressively to cold, unemotional math.
Black Boxes and the Overfitting Trap
Television networks desperately want a piece of this analytical pie. Broadcasters partner with tech firms to plaster live, pitch-by-pitch predictions across the screen. Apple TV’s foray into Friday Night Baseball tried to feed viewers exact probability percentages based on over 120 live variables.
The catch? The audience is too smart for flashy, flawed graphics. Fans immediately noticed when a batter took a called strike, only for his on-screen probability of reaching base to inexplicably rise. This is the classic machine learning trap of overfitting. An algorithm chews through millions of historical data points and finds stupid, spurious correlations, like a hitter performing magically better on Fridays against opposite-handed pitching. Independent analysts eventually tested these complex broadcast models against a simple baseline model that only factored in the current ball-strike count. Across a robust sample of 2,075 pitches, the simple count-based model posted a superior Brier score. It also would have yielded over 130 units of profit in a simulated betting environment.
Viewers ruthlessly reject an AI that lacks calibration. A broadcast graphic becomes a laughingstock if the math does not align with the physical reality on the field. This physical reality is captured flawlessly now, by the way. Wearable GPS vests are completely out. Invisible camera networks mounted on the stadium perimeter do the heavy lifting now. A system like YOLOv8 tracks absolutely every millimeter of action without ever touching an athlete. The actual engineering pipeline under the hood is absurdly dense. Specialists rely on homography matrices to morph flat 2D broadcast pixels into actionable 3D data. That heavy math essentially forces raw camera feeds onto a unified coordinate map of the field. Throw in tracking-by-detection frameworks, and the system can maintain a lock on ten different guys scrambling in a penalty box. Instance segmentation models (think Mask R-CNN) slice through the visual noise to separate overlapping bodies in real time.
Wall Street Mechanics in the Sportsbook
The financial markets absorb all this spatial tracking data, turning the modern sportsbook into a crowdsourced predictive engine. Wall Street’s old Efficient Market Hypothesis essentially lives at the sportsbook now. Massive professional betting syndicates deploy proprietary Monte Carlo simulations to hammer the market lines into shape. The final closing odds end up acting as a razor-sharp consensus of actual probability. You also have dedicated prediction platforms—places like Kalshi and Polymarket—functioning as pure financial exchanges. These sites weaponize the wisdom of the crowd to spit out real-time forecasts, and those crowd-sourced numbers routinely beat the smartest isolated models. A savvy fan knows how to mathematically strip the bookmaker’s profit margin—the vig—out of the line to reveal the raw, implied probability of an event.
Yet, structural inefficiencies still exist for those willing to hunt for them. The Favorite-Longshot bias is a perfect example of human psychology breaking the math. Regular people love the lottery-ticket thrill of betting on a massive underdog, so they artificially inflate the financial action on longshots. Bookmakers respond by suppressing the payouts on those underdogs while offering slightly better prices on heavy favorites to balance their books.
Data scientists trying to beat these markets quickly discover the accuracy paradox. An algorithm designed solely to predict the winner yields a high accuracy rate but loses money long-term due to this behavioral bias. The real cash goes to models optimized for pure probability calibration. These calibrated models identify the exact edge cases where the public’s risk-loving psychology has pushed the market line far away from statistical reality.
Monetizing the Dead Air
All this data requires a delivery mechanism, which brings us to the fractured nature of human attention. Nobody watches a three-hour broadcast linearly anymore. Roughly 80% of fans are staring at a second screen—a phone, a tablet, or a laptop—while the live game plays in the background. Let’s be brutally honest about the modern broadcast. Football and soccer feature an agonizing amount of dead air—everything from lengthy VAR reviews to mandatory TV timeouts. Sports leagues decided to aggressively weaponize live data just to capture that specific window of boredom. They push synchronized companion apps that feed the viewer real-time shot charts, physical exertion levels, and prediction markets.
The numbers paint a brutal picture for traditional TV executives. A mere 39% of the 18-to-24 demographic can even tolerate sitting through a full live broadcast. Compare that reality to the older generation—where roughly 61% of viewers over 65 gladly watch a game from wire to wire. Younger audiences simply refuse to consume media that way. Social media algorithms deliver the vast majority of sports content to nearly half of all fans aged 13 to 34. To hold the attention of Gen Z, you absolutely must feed them rapid, interactive micro-hits of data. Networks desperately fight this churn by gamifying the experience, literally turning empty commercial breaks into a massive profit center.
People mindlessly tap through free prediction games on their phones to guess the next play, relying completely on AI models loaded on their second screen. Arm a regular guy with a tiny sliver of statistical leverage, and his reluctance to pull the trigger vanishes instantly. Picture a sudden notification popping up in the seventieth minute. It informs the user that a star forward is currently beating his expected metrics by a staggering twenty percent. Armed with that tiny nugget of intelligence, the consumer is wildly more inclined to submit a micro-bet or tackle a trivia prompt. Teams lock in this psychological loop via digital loyalty programs—tossing out virtual badges just because someone opened an app during a halftime lull.
The executives running these leagues finally woke up to a harsh truth. Idle hands eventually cancel expensive television packages. Organizations keep those eyeballs locked in during timeouts—and deep into the barren offseason—by serving up a relentless stream of interactive models and gamified challenges. The actual sweat and grass of the physical product feels strictly secondary at this point. The real leverage in 2026 belongs to the company that owns the digital ecosystem built to predict the very next play.